


Create Dynamic Reports by Connecting Excel to SAP Business One
Effortless Data Management – Enable your team to seamlessly explore and analyze SAP data within Excel, turning complex datasets into clear, actionable insights with just a few clicks.
Tailored Reporting Solutions – Design and customize interactive dashboards that display live KPI metrics, driving smarter, data-informed decisions across retail and manufacturing operations.
Real-Time Financial Accuracy – Produce up-to-date financial reports, ensuring decision-makers have immediate access to the latest data for confident and informed strategic choices.
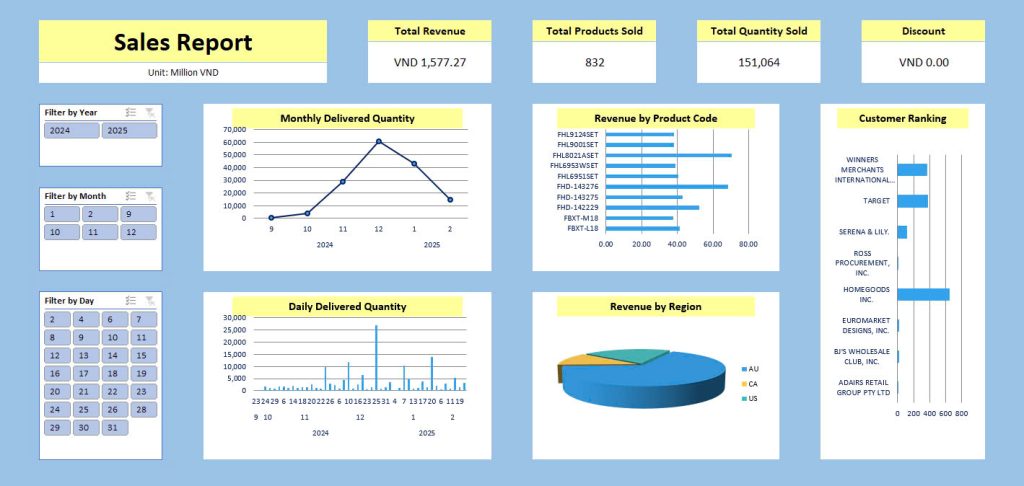
SALES REPORT – TOOL FUNCTION OVERVIEW
🛠 Report Functionality:
This sales dashboard is built using our automated reporting tool, designed to give businesses a clear, real-time view of sales performance. It enables teams to:
Track total revenue, quantity sold, and number of products sold
Visualize delivery trends by day and month for logistics planning
Analyze sales by product code and region to identify top-performing items and markets
Filter sales data by year, month, or day for detailed period analysis
View customer ranking to evaluate client contribution to revenue
Monitor discount activity, ensuring margin control
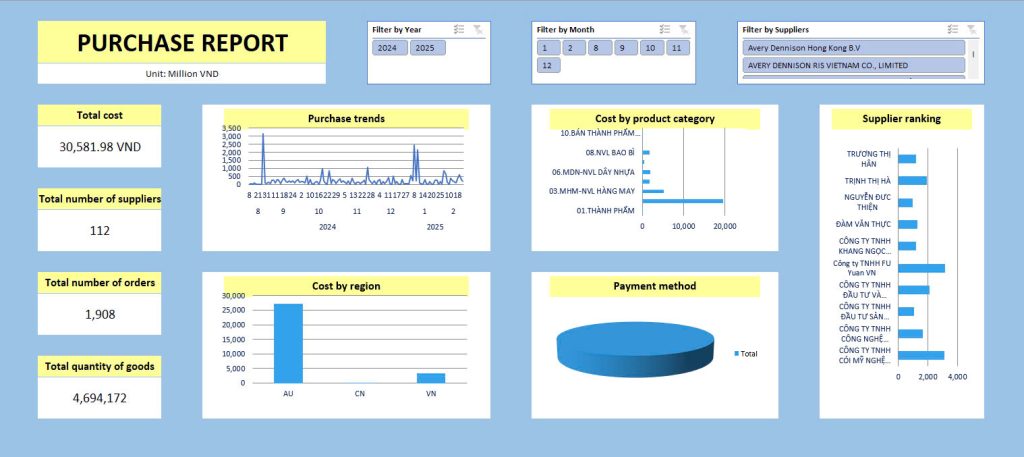
PURCHASE REPORT – TOOL FUNCTION OVERVIEW
🛠 Report Functionality:
This purchase dashboard is created using our automated reporting tool, designed to help businesses easily monitor and analyze procurement activities. The report supports:
Tracking total purchasing costs and trends over time
Analyzing spending by product category, region, and supplier
Visualizing supplier performance and rankings
Filtering data by year, month, or specific suppliers
Monitoring order volume and payment methods
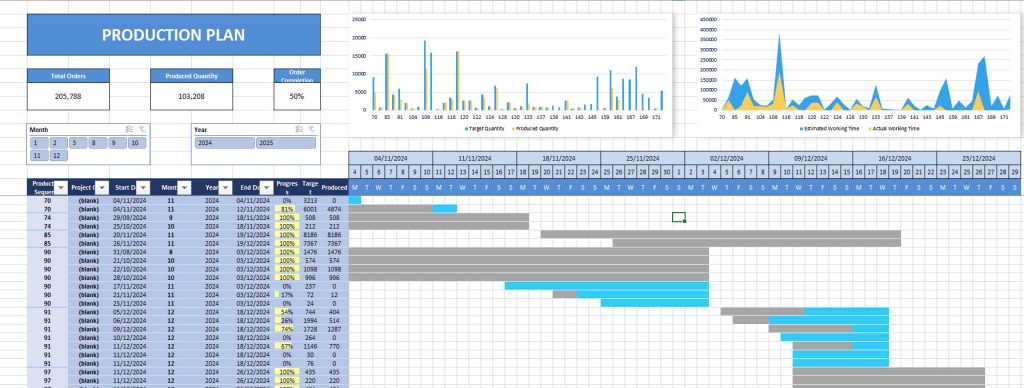
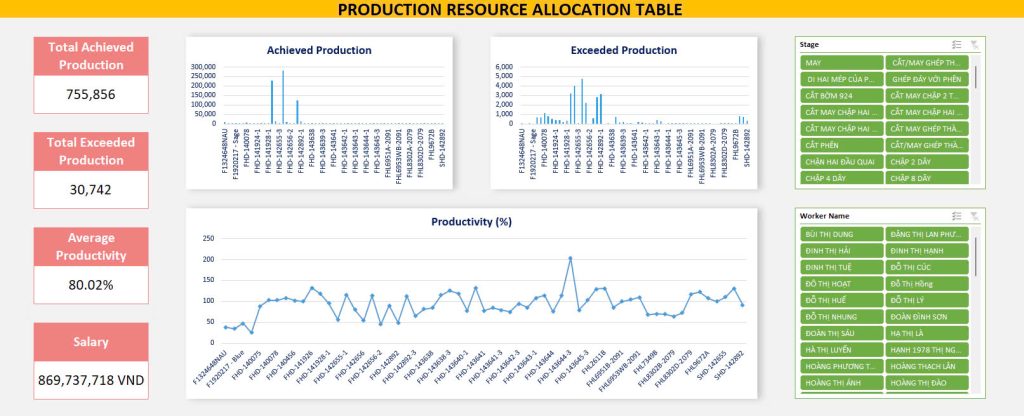
PRODUCTION RESOURCE ALLOCATION REPORT – TOOL FUNCTION OVERVIEW
Report Functionality:
This is a sample report generated using our automated reporting tool. The tool is designed to help businesses:
Automatically consolidate production data in real-time from multiple sources.
Visualize key metrics through dynamic charts showing output, excess production, productivity, and payroll.
Filter by stage or worker to evaluate individual or departmental performance in detail.
Auto-calculate critical indicators such as total achieved production, exceeded targets, average productivity, and total salary cost.
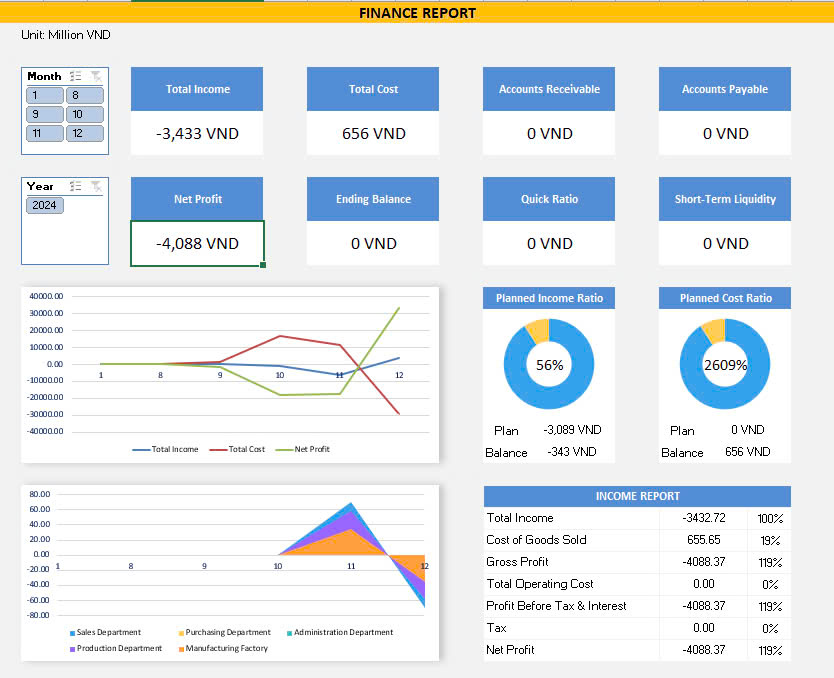
FINANCE REPORT – TOOL FUNCTION OVERVIEW
🛠 Report Functionality:
This financial dashboard is generated using our automated reporting tool, designed to help businesses manage and analyze financial performance more efficiently. Key features include:
Real-time tracking of core financial metrics: Total Income, Cost, Net Profit, Accounts Payable/Receivable.
Dynamic filtering by month and year for flexible period analysis.
Visual breakdown of income, costs, and net profit trends over time through charts and graphs.
Departmental comparison to assess expense distribution across functions (e.g., Sales, Production).
KPI indicators such as Quick Ratio, Liquidity, Planned vs Actual Ratios for both income and cost.
Automated financial summary, including Gross Profit and Profit Before Tax.
Cut Reporting Time and Double Employee Output
30%
![]()
Trimmed of reporting process
100%
![]()
Employee workload capacity
1
![]()
Source of Truth
Real-Time and Collaborative Financial Reporting
Empower your retail or manufacturing team with our solution for near real-time data access, custom reporting, and enriched insights through advanced visual analytics
- Near Real-Time Data
- Custom Reports
- Easy Data Refresh
- Custom Reports
- Visual Analytics
- Export to Excel
- Easy Data Refresh
- Collaboration Tools
- Scenario Planning