




In the era of smart manufacturing, data is the lifeblood that nourishes every strategic business decision. However, there is a paradox: the Board of Directors is often drowning in dozens of fragmented data sources but starving for the core insights needed to make decisions. Relying on static Excel reports or rigid templates from the IT department no longer meets the demands of today’s fiercely competitive landscape. To truly master the factory’s destiny, leaders need a visual Custom Reports system, empowering them to comprehensively monitor every aspect from production and inventory to quality with just a mouse click.
Key Takeaways:
– Speed of Decision Making: Real-time data helps leaders grasp bottlenecks as soon as they occur.
– Flexibility: Personalization allows for the design of specific KPIs tailored to each industry without relying entirely on IT.
– Power of Core Systems: Integration with comprehensive enterprise management software ensures data is always consistent and reliable.
– Intuitive Interface: Visual charts (Gauges, Bars, Lines) turn dry numbers into clear messages.
1. Why is Excel No Longer Enough for the Data Needs of the Board?
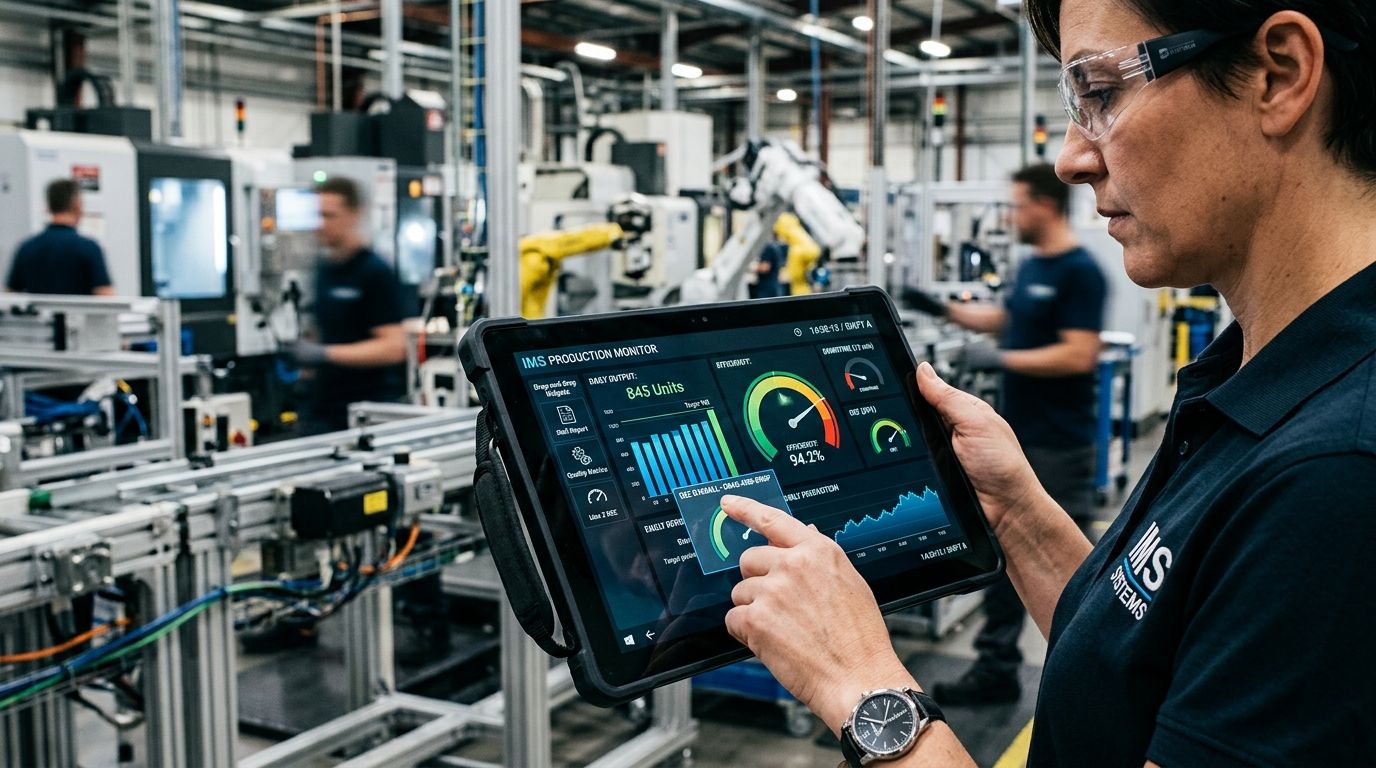
Many factories today are still proud of their massive Excel spreadsheets, programmed with complex macros. However, when faced with the pace of industrial production, Excel reveals fatal flaws. The biggest weakness is the “silence” of the data. A Plan vs. Actual report created yesterday is completely worthless if a plastic injection machine just suffered a technical failure this morning. The Board of Directors doesn’t need to know what happened yesterday; they need to know what problems the shop floor is facing RIGHT NOW.
Furthermore, manually aggregating data from multiple sources (HR, warehouse, workshop) creates a horrific latency. Employees spend hours copying, pasting, and reconciling figures. This process not only wastes human resources but also paves the way for human errors. When data is skewed, every strategic decision based on it harbors unpredictable risks. A modern MES (Manufacturing Execution System) completely overcomes this by automatically pouring data directly from machines to the central management system.
Example 1: Plastic Injection Molding
At a plastic injection factory in Binh Duong, the Production Manager used to wait until the end of the shift to know the scrap rate. When they switched to a real-time reporting system, as soon as a sensor indicated mold temperature exceeding limits, a warning chart blinked red, helping them stop the machine in time, saving thousands of defective products.
Illustration
2. Secrets to Designing Personalized Custom Reports on an ERP System
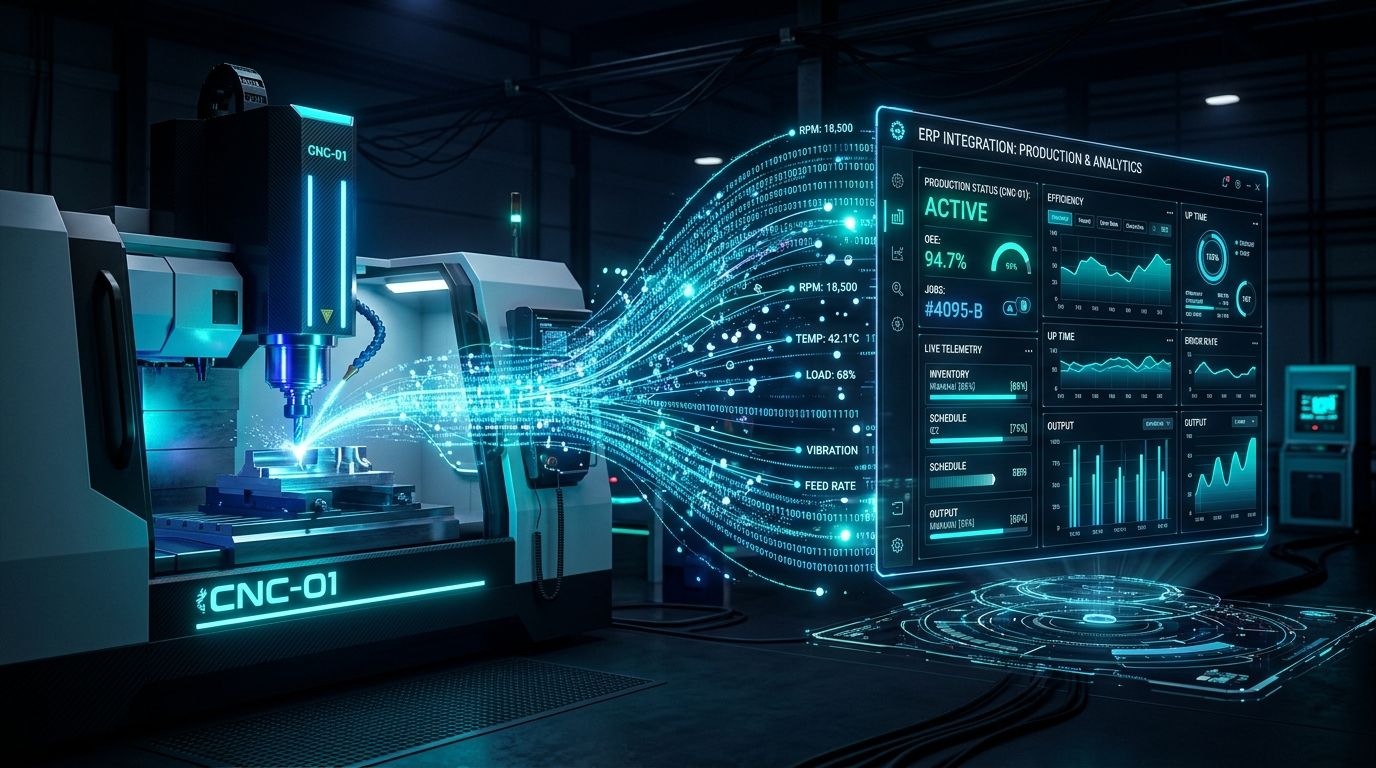
To build a true monitoring system, we cannot rely solely on cookie-cutter text templates. Every Board of Directors has a different “appetite” for reading data. The Chief Financial Officer (CFO) cares about cost prices and capital tied up in inventory (MRP plays a crucial role here). Meanwhile, the Chief Production Officer (CPO) keeps their eyes glued to OEE (Overall Equipment Effectiveness) and labor productivity. Therefore, core systems like ERP from SAP allow users to drag and drop to personalize Custom Reports without meddling with the source code.
The real power lies in decentralization and personalization. A perfect display system must function like an airplane cockpit: the pilot only sees the gauges most necessary for their mission. By setting up smart data queries, the system automatically filters and presents core indicators. You can set up automatic alerts: if the actual capacity of the shop floor drops below 80% of the plan, the screen automatically displays an orange warning. You can refer to more multidimensional management perspectives from Boyum Solutions.
Table: Factory Health Check Checklist via Reports
| Checklist Item | Symptoms Using Manual Tools | Solution via Real-time Dashboard |
|---|---|---|
| OEE Rate | Recalculated on weekends, doesn’t reflect true current capacity. | Gauge chart displays real-time. Green (Good), Red (Warning). |
| Order Progress | Shift leaders run to the floor to check every station. | Progress displayed visually as a Progress Bar for each Production Order. |
| Raw Material Inventory | Frequent material shortages due to disjointed book/actual data. | Min/Max inventory warnings blink continuously, auto-suggesting purchasing. |
| Bottlenecks | Only discovered when a process is severely backlogged. | System measures cycle time and detects delays instantly. |
Illustration
3. Steps to Implement Monitoring Dashboards Without Complex Coding
Deploying a personalized monitoring system isn’t magic; it’s a methodical process. The first and most crucial step is “Data Requirements Definition.” The Board must answer: “What 3 metrics are vital to the factory’s profitability this quarter?”. If the issue is delayed deliveries, metrics related to the APS (Advanced Planning and Scheduling) system, like “On-Time In-Full (OTIF),” must be front and center, large and clear on the screen.
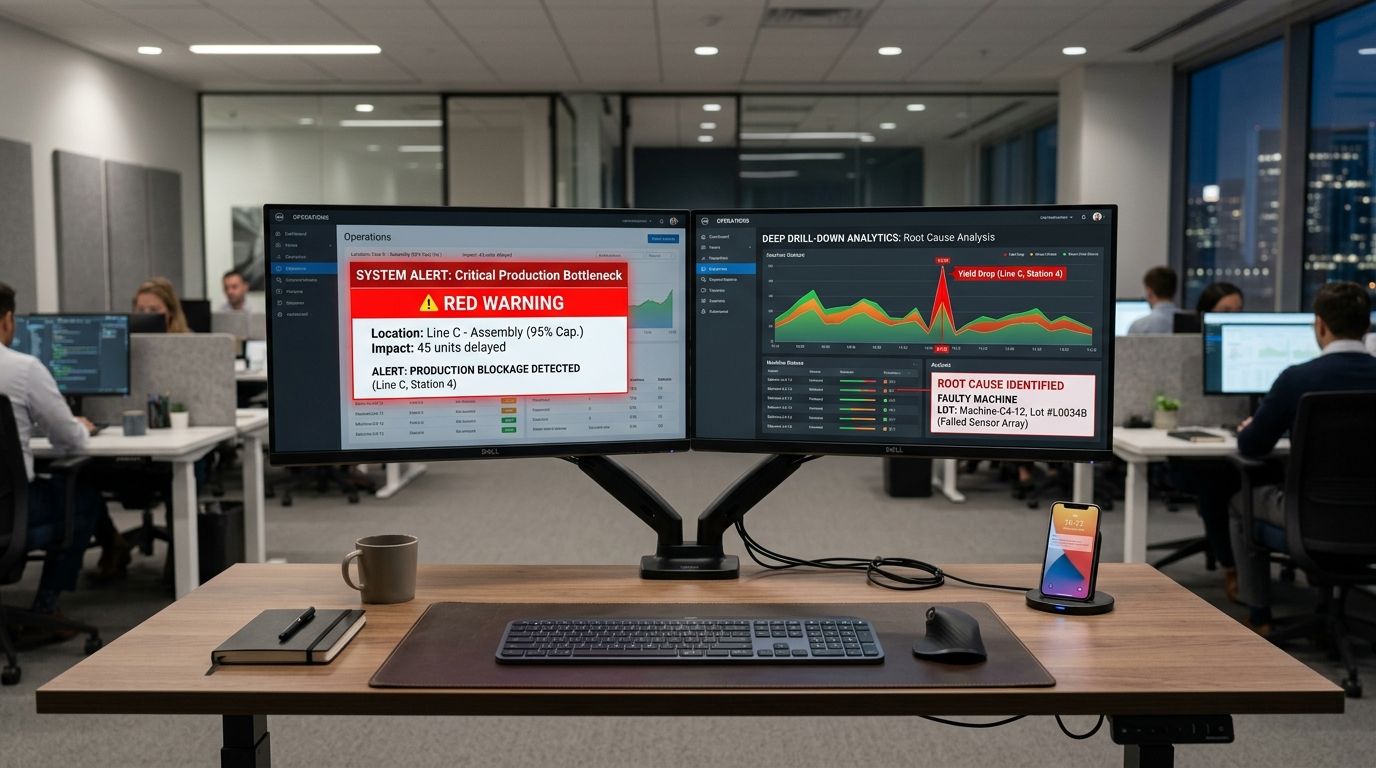
The next step is to leverage built-in data analytics tools. Today’s specialized manufacturing software provides extremely powerful widget toolsets. Users just write a simple SQL query (or use visual design tools) to call the data, then choose the appropriate chart type (Pie, Bar, Line). Don’t forget to configure the “Drill-down” feature. This feature is incredibly potent: when the Director sees a spike in scrap, they just click that chart column to drill down to the exact production lot, shift, and even the ID of the operator running the machine.
Example 2: Electronics Assembly
In the microchip assembly industry, traceability is mandatory. An electronics assembly company set up a dedicated control panel to track every component barcode. When a defective component was found, the Quality Assurance (QA) Director used the “Drill-down” function to find the exact soldering machine that caused the error, isolating the entire suspect batch in just 5 minutes.
Illustration
4. Mistakes to Avoid When Implementing Custom Reports for the Factory
When setting out to build Custom Reports, many businesses fall into the trap of trying to have it all. The most common mistake is cramming too many KPIs onto a single screen. An interface cluttered with numbers and charts doesn’t help the Board make faster decisions; instead, it causes “Information Overload.” Remember the rule: The simpler, the more effective. Focus only on 3-5 metrics that are “vital” to the current strategy.
The second mistake is ignoring the quality of input data. No matter how beautifully designed a dashboard is, it becomes meaningless if the underlying data is garbage (Garbage In, Garbage Out). If factory workers frequently forget to scan barcodes or enter data late, the charts in the boardroom are just phantom numbers. Therefore, before drawing charts, ensure the data collection terminal network on the shop floor is stable and employees strictly follow data entry procedures.
Example 3: Precision Machining
A precision machining workshop once designed a very complex machine status tracking screen but neglected to train workers on how to enter downtime reasons. As a result, the Downtime chart consistently showed an “Unknown Error” rate of up to 80%, leaving managers unable to find the root cause to optimize maintenance.
5. FAQs (Frequently Asked Questions)
Q: Do I need to hire a top-tier programmer to create these tracking boards?
A: Absolutely not. Most modern enterprise systems offer Drag & Drop tools and intuitive report builders friendly to end-users, requiring no deep coding skills.
Q: How long does it take for data from shop floor machines to update on the Director’s screen?
A: If your factory is connected via IoT devices or has a robust network of data entry terminals, the latency is practically zero (real-time).
Q: Can I view these dashboards on my mobile phone while on a business trip?
A: Definitely. Modern web architecture allows these parameters and charts to render smoothly on mobile browsers or via dedicated applications.
Register for a Demo session of the MES System customized specifically for your factory’s operational map at INFOASIA!

InfoAsia Việt Nam trở thành nhà cung cấp dịch vụ phần mềm số hóa nhà máy sản xuất cho thương hiệu giày hàng đầu thế giới NEW BALANCE
Công ty TNHH Mây Tre Hà Linh
SAP ERP MES and IOT Project for FVIV Factor
Buwon Industry Co, Ltd
KANGLONGDA VIETNAM PROTECTION TECHNOLOGY COMPANY LIMITED
Shini Group
TA TING PLASTIC (HAI DUONG ) CO., LTD
CÔNG TY TNHH MTV BIÊN HOA SCM