




Stepping onto the factory floor, the deafening roar of machinery and continuously moving conveyor belts often create a perfect “illusion” of high productivity. At the end of the shift, workers hastily scribble on their report sheets: “Stamping machine ran a full 8 hours without stopping.” However, when reconciling these numbers with the actual finished goods hitting the warehouse, management invariably discovers a baffling 20% shortfall in production volume. Thousands of sporadic, isolated minutes of machine downtime (micro-stops)—waiting for raw materials, clearing a jammed wrapper, or searching for a misplaced tool—are completely swallowed up by the “rounded up” numbers on paper. The greatest pain for a plant manager is not when a machine suffers a catastrophic breakdown, but rather the profound “blindness” regarding the true efficiency of their equipment during every single shift. As long as you rely on paper and Excel to measure performance, you are managing your factory based on a data mirage. It is time to unmask these hidden costs by calculating the Overall Equipment Effectiveness (OEE) in real-time through an MES (Manufacturing Execution System).
Key Takeaways:
– The OEE (Overall Equipment Effectiveness) index is the most comprehensive metric for manufacturing efficiency, comprising three core elements: Availability, Performance, and Quality.
– MES Software (specifically systems like Beas Manufacturing integrated with SAP ERP) completely eradicates manual data collection, automatically extracting data from workstations to calculate OEE in real-time.
– Through the Beas Manufacturing Terminal interface on the shop floor, workers can effortlessly declare downtime reasons and defect rates using barcode scanners, ensuring OEE data reflects the reality with 100% accuracy (Single Source of Truth).
– Real-time OEE monitoring empowers plant managers to instantly identify “bottlenecks” and micro-stops that are perpetually omitted in paper reports, thereby driving Lean Manufacturing initiatives.
– Grasping the actual true capacity through OEE is the fundamental prerequisite that allows the Beas APS Dashboard to schedule production accurately, preventing the overloading of orders that shatters delivery timelines.
1. The True Nature of OEE and the Tragedy of Manual Measurement
1.1 The Truth Behind the OEE Metric
Many factories operate under the misconception that “if the machine is running, the factory is efficient.” The reality is vastly more complex. OEE (Overall Equipment Effectiveness) is a holistic metric that evaluates exactly how efficiently a machine or a production line is operating relative to its maximum potential. OEE is derived from three rigorous variables:
– Availability: Did the machine run during its scheduled operating time? (Deductions are made for breakdowns, maintenance, or changeover/setup times).
– Performance: When running, did the machine achieve its designed standard speed? (Deductions are made for minor jams, material blockages, or operating at a reduced speed).
– Quality: What percentage of the produced items were Good Parts on the very first pass? (Deductions are made for NG defects or items requiring rework).
If each of these three factors only scores 90%, your actual OEE plummets to: 0.9 x 0.9 x 0.9 = 72.9%. This is a brutal reflection of reality that many managers prefer not to face.
1.2 The Data “Mirage” When Calculating OEE with Excel
Under traditional management methods, workers are typically handed a piece of paper to log machine running hours and defect quantities. This approach carries fatal blind spots. First, human nature tends to “beautify” data; a worker will rarely self-report that a machine stopped for 5 minutes because they went for a water break or chatted with a colleague. These short interruptions (micro-stops) accumulate into hours of wasted time each month but never appear on the official report. Second, the manual transcription process from paper to Excel involves massive latency (usually finalized the next day), rendering the data entirely “cold.” By the time the production manager notices a drop in OEE due to a quality issue, that specific batch of goods might have already been fully packaged, stripping the factory of any opportunity to intervene and correct the issue directly at the line.
2. How Does MES Software Solve the Real-Time OEE Puzzle?
2.1 Transparent Data Collection via Beas Manufacturing Terminal
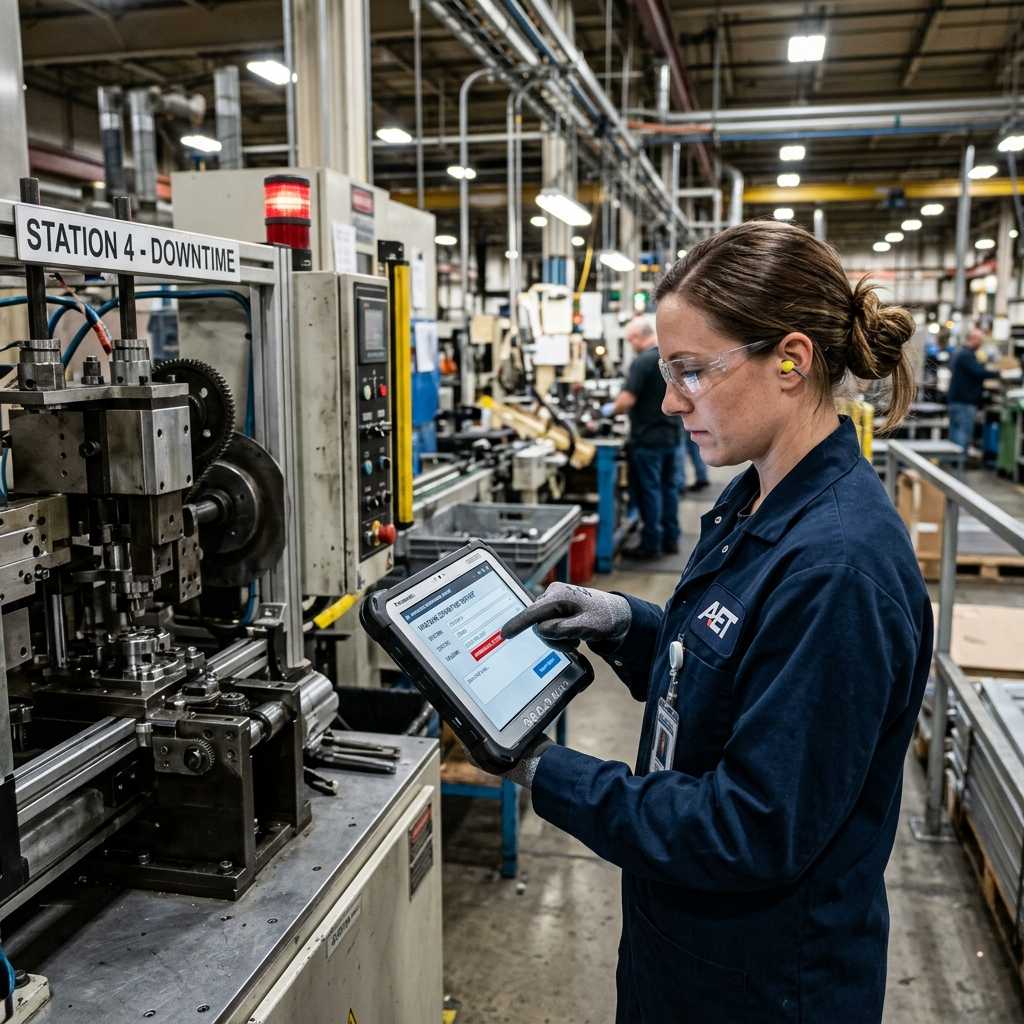
The heart of accurate OEE calculation lies in the ability to collect data directly from the Shop Floor without it being “distorted” by human emotion or estimation. An MES Manufacturing Execution System solves this problem by equipping each workstation with a Beas Manufacturing Terminal interface. At the start of a shift, the worker simply scans their Barcode/RFID badge to log in and scans the production order barcode. At that exact moment, the system starts the clock (Availability). If the machine encounters an issue, the worker merely taps the touchscreen to select a standardized error code (e.g., Material Jam, Broken Wire, Waiting for Tool Sharpening). Through this minimalist action, all Downtime is recorded accurately down to the second, creating a Single Source of Truth that allows the system to run OEE calculation algorithms automatically without any manual intervention.
2.2 Visualizing “Bottlenecks” via a Central Dashboard
OEE data only holds true value when it is visualized to serve decision-making. Instead of dry Excel spreadsheets, the MES System displays OEE metrics (including the individual A, P, Q percentages) on a large central Dashboard positioned prominently on the factory floor. Any machine with an OEE dropping below the standard threshold (for instance, below 75%) will immediately flash a red warning. This allows production directors to instantly detect exactly which “bottleneck” is holding back the entire assembly line. Grasping this actual capacity in real-time is also vital input data for the Beas APS Dashboard within the SAP ERP MRP system. It enables highly accurate finite capacity scheduling for subsequent shifts, avoiding the dangerous practice of cramming orders that inevitably breaks production schedules.
2.3 Root Cause Analysis to Drive Lean Manufacturing
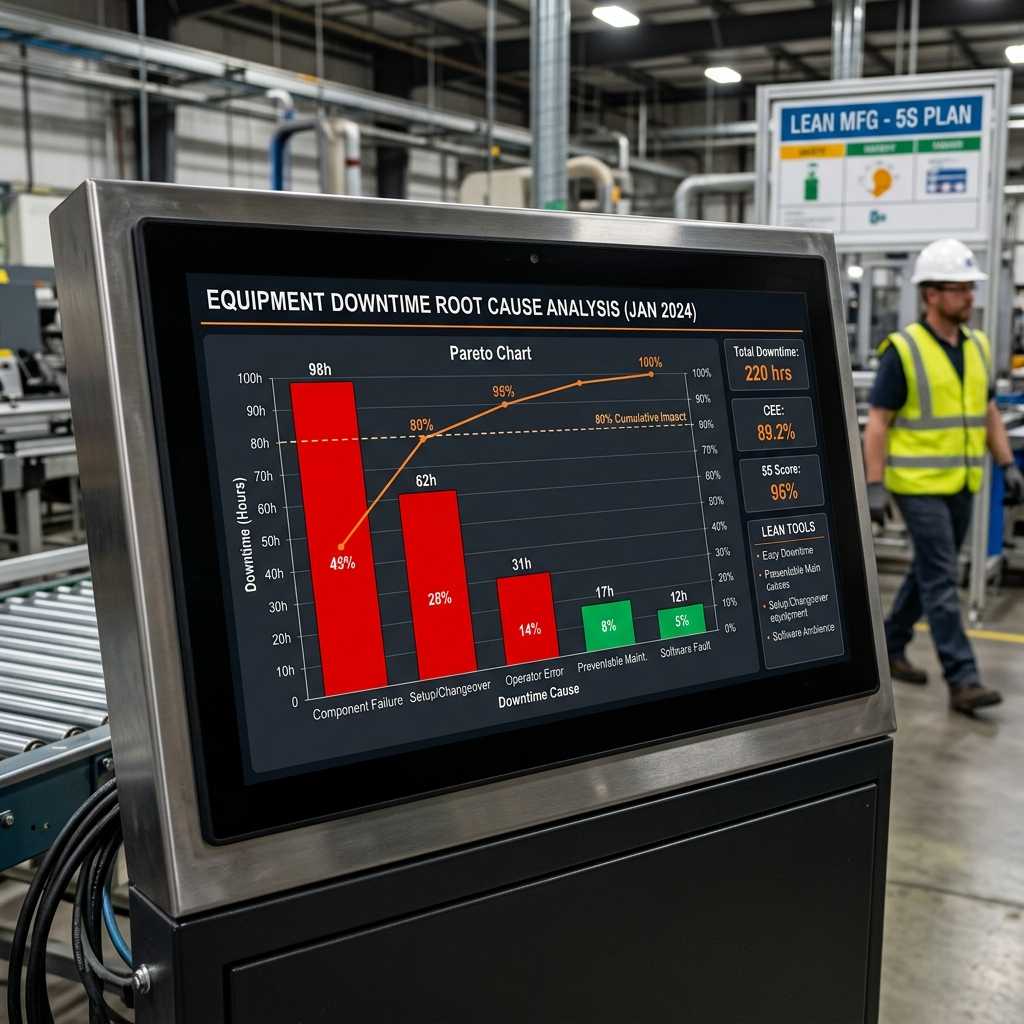
Going far beyond simply reporting a lifeless percentage, MES software dives deep into dissecting the root causes of OEE degradation. By archiving the complete history of Downtime Reasons declared by workers on the Terminal, the system generates Pareto charts (the 80/20 rule) to pinpoint exactly which 20% of the causes are generating 80% of the factory’s downtime. For example, the system might reveal that “waiting for raw materials from the warehouse” accounts for 30% of all machine stoppages. Armed with this ironclad data evidence, leadership can immediately apply Lean Manufacturing principles—such as establishing a Kanban material replenishment process—thereby eliminating waiting waste and elevating the OEE metric to new heights.

3. Comparison Table: Manual OEE vs. Automation via MES System
| Criteria | Manual OEE Calculation (Paper/Excel) | Automation via MES Software |
|---|---|---|
| Data Accuracy | Highly susceptible to human bias. Workers frequently round numbers or ignore minor incidents. | 100% absolute accuracy. Data is logged down to the second via the terminal system. |
| Tracking Micro-Stops | Virtually impossible to record. Pauses of 1-3 minutes are ignored, creating an artificial OEE score. | Captures every single moment of Downtime through instant barcode scanning or screen tapping. |
| Reporting Latency | High latency; usually requires waiting until the end of the shift or the next day for accounting to input data. | True Real-Time. All OEE fluctuations are displayed instantly on the Dashboard. |
| Scheduling Support (APS) | No integration. OEE data serves merely as a retroactive reference. | Actual capacity data is pushed directly to the Beas APS Dashboard to update production schedules instantly. |
| Root Cause Traceability | Extremely difficult due to vague, handwritten, and inconsistent error descriptions. | System provides standardized error analysis charts, enabling immediate Lean Manufacturing countermeasures. |
4. 5 Real-World Examples of Productivity Breakthroughs Powered by MES OEE
Example 1: Uncovering Hidden Downtime Caused by Mold Changeovers.
Plastics Injection Factory A always believed their machines were running exceptionally well. When they implemented OEE tracking via MES, they discovered their Availability metric was only hitting 60%. The root cause: the time workers spent stopping the machine to change molds (Changeover Time) was taking 45 minutes per swap instead of the standard 15 minutes. By applying the SMED (Single-Minute Exchange of Die) methodology, they slashed changeover times down to 12 minutes, rocketing their overall OEE up by an additional 18%.
Example 2: Preventing Defect Escapes with Real-Time Alerts.
At Metal Stamping Plant B, workers used to stamp out 1,000 products before bringing them to Quality Control (QC), risking the entire batch being scrapped. Since deploying the Beas Manufacturing Terminal, the moment a worker declares a scrap rate hitting 3% on the terminal, the Quality metric on the OEE dashboard drops into the red zone. The manager instantly receives an alert, heads down to halt the machine, and recalibrates the stamping die, saving 500 products from becoming scrap metal.
Example 3: Eliminating the Packaging Bottleneck.
Food Company C constantly wondered why their main production line ran so fast, yet orders were always delivered late. Thanks to the MES System Dashboard, they clearly saw that the OEE of the automatic packaging machine was perpetually hovering at a low level (under 50%) due to continuous plastic film jams. They made the data-driven decision to switch to a higher-quality film roll, instantly unclogging the entire production flow.
Example 4: Increasing Machine Speed (Performance) Based on Hard Data.
The manager of Woodworking Factory D was terrified of running the CNC machines at maximum speed for fear of breaking cutting tools. The MES System continuously collected OEE data and definitively proved that at an 85% operating speed, the machine remained extremely stable with an NG (defect) rate of 0. Relying on this data, the board of directors confidently raised the standard production speed limit, boosting output by 12% per shift without the need to invest in any new machinery.
Example 5: Precise APS Scheduling Eliminates Order Cramming.
Packaging Plant E previously suffered from chronic missed deadlines because the Planner always scheduled based on the theoretical capacity of the printing press (1,000 meters/hour). The MES system measured and fed back the actual OEE of that specific aging printer, which was only achieving 75%. Instantly, the SAP ERP MRP algorithm and the Beas APS Dashboard automatically stretched the timeline for pending orders, providing the factory with a finite capacity schedule that was 100% accurate and feasible.
5. Frequently Asked Questions (FAQs)
Q: My factory employs many older workers; will they be able to use the Terminal screen to report OEE?
A: Absolutely. The Beas Manufacturing Terminal interface is designed to be highly intuitive, featuring large, color-coded icons. Workers do not need to perform complex data entry using a keyboard. They simply use a barcode scanner to scan the work order and tap a single button on the touchscreen to report a machine stop or log the quantity of defective parts.
Q: If our machinery is very old and lacks a PLC port for automated connectivity, can MES still calculate OEE?
A: MES software is completely flexible. If a machine lacks an automated connection port (PLC/IoT), OEE data is calculated based on the worker’s manual declarations on the Terminal workstation. Even though it involves manual input, because the action is performed in real-time and tracked by the second, the resulting OEE data is infinitely more accurate than writing numbers on paper at the end of the day.
Q: Is a low OEE score always the fault of the machine operator?
A: Not at all. An MES system clearly delineates responsibility (Single Source of Truth). In many cases, a low OEE (high downtime) is caused by the Purchasing department delaying material delivery (Waiting for Materials), or the Maintenance department failing to perform preventive upkeep leading to a breakdown (Waiting for Repair). MES makes the data transparent so all departments can collaborate on improvements, rather than unjustly blaming the operators.
Q: Can the MES System calculate OEE individually for each employee to serve as a baseline for KPI bonuses?
A: Yes, it certainly can. Because employees must swipe their barcode badge to log into a production order when starting work, the MES system directly links the performance of that specific machine during that timeframe to the corresponding employee ID. This creates a highly fair, transparent, and objective KPI evaluation system grounded in actual hard data.
Q: Does tracking OEE on MES benefit the overarching SAP ERP system model?
A: Immensely. OEE data is the “lifeblood” of SAP ERP systems. It provides the Actual Capacity needed for the SAP ERP MRP algorithm to accurately calculate exactly when to purchase materials, and it enables the Beas APS Dashboard tool to schedule and allocate resources in the most optimal manner (Finite Capacity Scheduling). Without precise OEE, an ERP system is merely planning based on blind assumptions.
Register for a tailored Demo of the MES Manufacturing Execution System, customized specifically for your factory’s operational layout, today at INFOASIA!

InfoAsia Việt Nam trở thành nhà cung cấp dịch vụ phần mềm số hóa nhà máy sản xuất cho thương hiệu giày hàng đầu thế giới NEW BALANCE
Công ty TNHH Mây Tre Hà Linh
SAP ERP MES and IOT Project for FVIV Factor
Buwon Industry Co, Ltd
KANGLONGDA VIETNAM PROTECTION TECHNOLOGY COMPANY LIMITED
Shini Group
TA TING PLASTIC (HAI DUONG ) CO., LTD
CÔNG TY TNHH MTV BIÊN HOA SCM